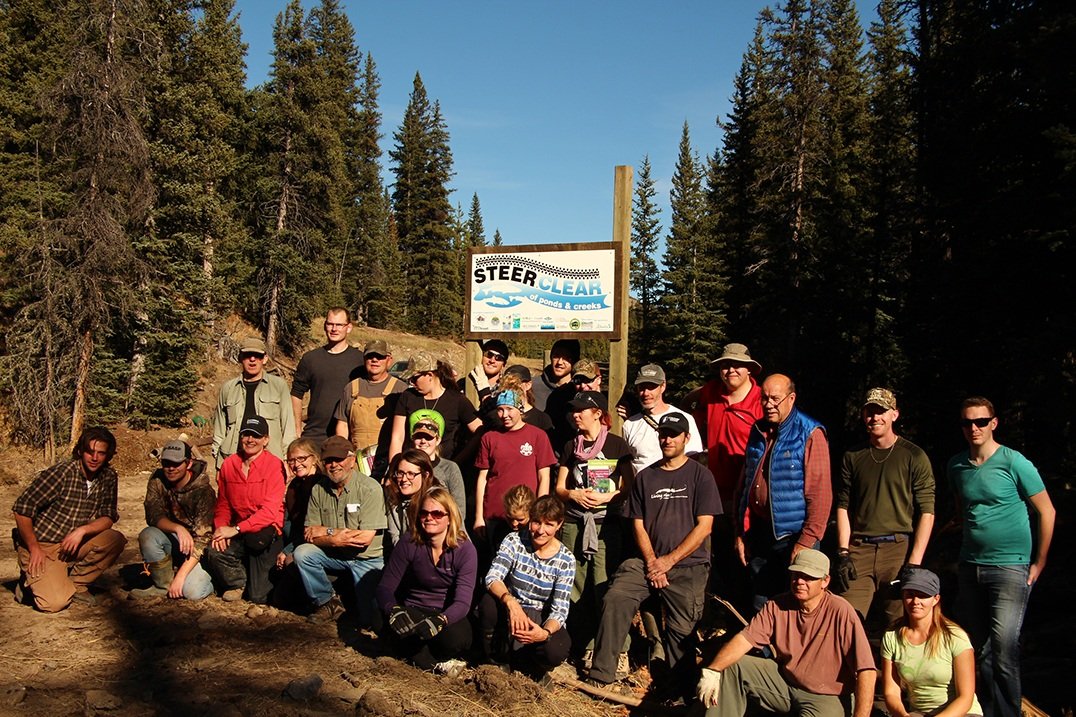
*Editors Note: What does it matter how many trails there are in the backcountry? What does it matter whether it's a hiking trail or a seismic line? How does a trail way up in the mountains (or down in the valley for that matter) affect water quality downstream?
OWC has been getting requests from OHV users, hikers, hunters, fishers, and other back-country users asking for the OWC to explain the significance of roads and trails in our headwaters. We hope that this blog can help everyone to understand better what kind of scientific research has been done so far to assess the ecological impacts of linear features. One thing is certain, and that's the need for further research to assess how the type of use and intensity of use can change the ecological effects of linear features.
Please ask questions in the comment section below, and we will do our best to answer based on peer-reviewed scientific research. *
By Rob Taylor, OWC Staff
What is a linear feature?
Linear Features are all the roads, seismic lines, power lines, pipelines, railroads, cut lines, and recreational trails we leave on the land: it's about how we are fragmenting the landscape. How many linear features (measured in kilometers) exist in an area of land is known as “linear features density”. Linear features density is one of the ways we can measure what impact we are having on the landscape. Many linear features on public land were created for industrial purposes, such as logging or oil and gas, and some came from cattle grazing, fire management, and recreation.
In order to determine linear features density, there are some basic calculations that need to occur. First, using satellite imagery or on-the-ground assessments, the total length of all the linear features on a landscape is determined. This value is then divided by the total area of the landscape to determine an average density. This provides a value that is measured in kilometers of linear features per square kilometer.
**Something important to note about Linear Features Density is that it represents an AVERAGE value. In other words, when you say that there is a certain length of linear features per square kilometer, this DOES NOT mean that there is that many linear features on every single square kilometer. In some areas this value will be much higher (travel corridors or near staging areas) and in some areas it will be next to nothing.**
In 2014, the Alberta Government approved the South Saskatchewan Regional Plan (SSRP). This document was meant to guide the future of land use in the South Saskatchewan Watershed (which the Oldman watershed is a part of!). One of their key goals for the headwaters was to reduce the Linear Features Density on public lands. The Oldman Watershed Council has commissioned studies looking at linear features density in the Dutch Creek sub-watershed, and it was one of the metrics used to assess watershed integrity in our Headwaters Indicators Project. The results of these studies have also been shared with the provincial government, and were just one of many scientific sources the government has used to help develop their sub-regional land use plans.
It is important to note that linear features density is only one measure of watershed health. The more measures applied, the clearer the picture is. The value of a measure is increased when we look at it in conjunction with other indicators of watershed health such as erosion potential, slope, intact landscapes, rare plant communities, and other metrics.

Some wildlife can become habituated to Linear Features and Human Activity; others aren't so lucky - meaning that some wildlife can get used to humans and trails and don't abandon their homes and start moving to a lower quality habitat area.
How does the density of linear features affect wildlife/habitat?
Specific linear features density thresholds have been established for a variety of species and other measures of ecosystem function. These thresholds can be species-specific and vary across different ecosystems. This is why it is so important to do more research into this field to determine how different species in different environments react to different types and intensities of use on the landscape.
Below are just a few of the peer-reviewed studies that have looked into the effects of linear features density on a variety of species found in the headwaters of the Oldman basin:
- Forman and Alexander 1998 Pg. 223: “A road density of approx. 0.6 km/km 2 (1.0 mi/mi2) appears to be the maximum for a naturally functioning landscape containing sustained populations of large predators, such as wolves and mountain lions (Felis concolor) (43, 76, 124). Moose (Alces), bear (Ursus) (brown, black, and grizzly), and certain other populations also decrease with increasing road density (11, 43, 72). These species are differentially sensitive to the roadkill, road-avoidance, and human access dimensions of road density. Species that move along, rather than across, roads presumably are benefitted by higher road density (12, 39).”
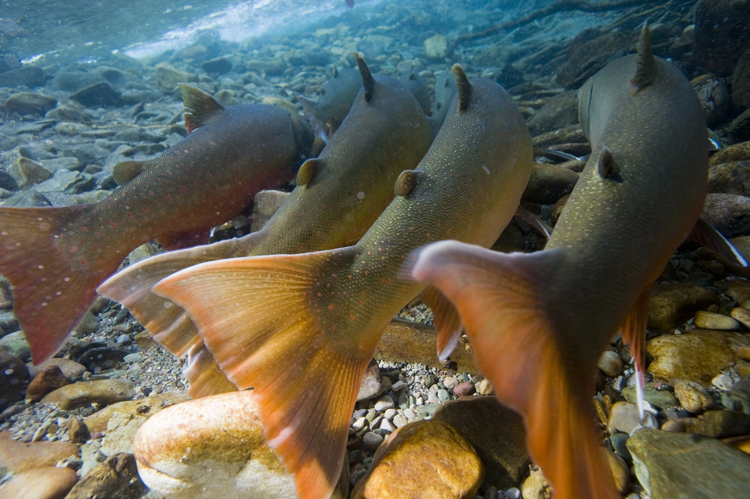
- Bull Trout at high risk when Linear Features Density >0.6km/km2 and extirpation >1.0km/km2. (AESRD 2012)
- There exists negative relationships between cutthroat trout abundance and road density, roads on erodible soils, and roads within near-stream zones. (Valdal and Quinn 2010)
- Moose population densities in Nova Scotia are strongly correlated with road densities. Deleterious biological effects extend more than 1000m from roads. Linear features density is determined to be a better predictor of moose abundance than traditional habitat suitability indices (i.e. location of food resources, thermal cover, etc.). Linear features densities more than 0.6km/km2 is the apparent threshold at which populations of large vertebrates begin to decline. (Beazely et al 2004)
- Road densities <0.5km/km2 was the strongest predictor of Elk occurrence in Alberta Foothills. (Frair et al 2000)
- Grizzly Bears decline at LFD above 0.4km/km2. (Boulanger and Stenhouse 2014; Wilkinson et al. 2008)
- Occupancy of American Marten declines to 50% at linear densities of 3km/3km2. (Tigner 2012; Wasserman et al. 2012)
- Bird Abundance declines at seismic line densities above 8.5km/km2. (Bayne et al. 2005)

Linear Features near streams have a strong negative correlation with the abundance of Westslope Cutthroat Trout. Down to 5% of their range, they have been federally designated as 'Threatened' under the Species At Risk Act (SARA).
What are the shortcomings of using LFD as a measure to ecosystem health?
One of the big assumptions made when using linear features density to assess ecosystem health is that the model assumes all linear features are equal. To date there has been little research done into how the type of use (motorized vs non-motorized) or intensity of use (is there 1 user a week, or 10,000 per day?) may affect the response by wildlife to different linear densities. More research is needed in Alberta to understand what types of roads and trails are best suited to the sensitive ecosystems of our headwaters.

There has been little research into how intensity/type of use on linear features can change their impact on the watershed.
One study completed in Oregon looked at the response of elk and mule deer to ATVs, mountain bikes, horseback riders, and hikers. They concluded that elk reactions were more pronounced during ATV and mountain bike riding, and they were less so during horseback riding and hiking (Wisdom et al. 2004). Additionally, elk flight responses were greater around ATV and mountain bike use, up to 1500m, compared to 500m from hikers and horseback riders. Creel et al. (2001) noted that elk and wolf stress hormone production was positively correlated (means: more stressed out) with the intensity of snowmobile activity in the Greater Yellowstone Ecosystem.
Again in the greater Yellowstone, moose bedding and feeding within 300m of snowmobile trails altered their behaviour by moving to less favourable habitat. Proximity to trails and frequency of trail use by people were the most significant factors in this change in behaviour (Colscott and Gillingham 1998).
For some species, however, the impacts of linear features continue even when there aren't any users on the trail, road, or cutblock. Linear features act as secondary channels for water during rain events, so sediment will continue to be mobilized once the vegetation is gone (means: trails remove vegetation, and lack of vegetation means muck runs into the streams). Stream fords change the morphology of the stream channel, making the stream wider and shallower, often for quite a distance downstream. This slows down the water, allowing it to warm up and hence decreases the concentration of dissolved oxygen (means: crossing through the river has a huge impact).
Sediment transported from the nearby trails increases the percent of fine particles in the stream. This can smother trout redds (baby fish nurseries) and removes habitat for aquatic invertebrates (fish food like insects, mollusks, and worms that live in water) (Marion et al. 2014). The USDA concluded that OHV trails had 56% higher runoff and 625% greater sediment transport than adjacent vegetated lands (Meadows et al. 2008).

Type of use can be as important as density of linear features
There is very little data to show at what scale linear features density becomes meaningful (as in: on a little stream or on a huge river). In the production of our own Headwaters Indicators Project, the OWC used 4th order watersheds
(for statistic geeks: https://en.wikipedia.org/wiki/Strahler_number).
This scale satisfied our requirements for many of the other indicators of watershed integrity we hoped to measure.
Clearly, when talking about the effects of linear features, we are looking at interactions that occur on a variety of spatial and temporal scales. Depending on the variable, it may be appropriate to look at a very fine scale of a few acres (i.e. identifying critical habitat for amphibians), or it may be necessary to look at an entire region (i.e. the Oldman Headwaters).
Relevance to the Castle Region
Just using the Alberta Base Features Dataset, the proposed Castle Provincial Park already has 0.47km/km2 of linear disturbance. This dataset only includes open roads (pavement, gravel, and forestry access roads) - and not trails. This is approaching the thresholds for many of the species noted above. Global Forest Watch commissioned a study showing that if all linear features are included, the proposed provincial park has a LFD of 3.5km/km2. This is far above the threshold for many of the species at risk that inhabit the Castle Region. To meet the habitat requirements for many of these species, it will be necessary to reduce the density of linear features in the Castle. This will mean decommissioning and reclaiming trails in the region until it approaches the 0.6km/km2 threshold noted above.
The Oldman Headwaters Indicator Project found the Castle region sub-watersheds (fourth Strahler order) ranged from high risk/pressure to low risk/pressure from density of all linear features.
- Highest risk/pressure (greater than 3.0 km/km2 ) and moderate risk/pressure (1.2 – 3.0 km/km2 ) extended across sub-watersheds in the upper regions of the proposed Castle Parks.
The lowest pressure/risk (less than 0.6) was found in sub-watersheds in the southwest extent of the proposed parks.
In another region of the Oldman Headwaters, OWC commissioned the Dutch Creek Linear Features Classification Project. This was a study to investigate linear features density in Dutch Creek, a tributary stream of the Oldman River located in the Rocky Mountains. This study determined that Dutch Creek has about 1.1 kilometres of these linear features for every square kilometer, again exceeding thresholds for many of the species mentioned above.
The Dutch Creek Linear Classification Project also found 232 stream crossings along the length of Dutch Creek, and only about 10 of these crossings had an associated log or metal and wood bridge. Given that the main stem of Dutch Creek is approximately 30km long, this means that there are about 8 stream fords per kilometer of stream. There is a high density of ford crossings on active features at the west end of Dutch Creek, which overlaps with 70% of key Bull Trout spawning areas (redds) surveyed by Alberta Environment and Sustainable Resources Development (ESRD) in 2012.

Map of the linear features density in the Dutch Creek Watershed. Map created for the Dutch Creek Linear Features Classification Project. See a previous OWC blog about this here: https://oldmanwatershed-council.squarespace.com/blog-posts/2015/01/linear-features-in-oldman-watershed.html?rq=Dutch%20Creek
Risk to watershed health from linear features is, in fact, an issue throughout Alberta. This is a sobering thought. The risk to the health of the land and water that supports all of us who live and work downstream needs careful attention. This includes education of all users and a willingness of all users to address the issues that come with increasing linear features density in the headwaters.
Linear Features Density is just one measure we use to assess watershed health. We also incorporate multiple indicators such as soil type, erosion potential, slope, and intact landscapes, such as OWC did in its Headwaters Indicators Project. This report clearly shows that much of the headwaters is under intense pressure from the cumulative impact of all types of use.
If we want to ensure clean, cold, and plentiful water for generations to come (for your kids and grandkids!) it is important that we all - hikers, quadders, ranchers, industry, EVERYONE, - work together to tackle the problem of linear features. The headwaters are the water tower of southern Alberta. What we do in the headwaters affects all of us.
WE ARE ALL DOWNSTREAM.
References
Alberta Bull Trout Conservation Management Plan 2012 – 17. 2012. Alberta Environment and Sustainable Resource Development (AESRD). 2012. Alberta Species at Risk Conservation Management Plan No. 8. Edmonton, AB, 90 pp.
Beazley, K. F., Snaith, T. V., Mackinnon, F., & David, C. (2004). Road Density and the Potential Impact on Wildlife Species such as American Moose in Mainland Nova Scotia. Proceedings of the Nova Scotian Institute of Science
Boulanger J, Stenhouse GB (2014) The Impact of Roads on the Demography of Grizzly Bears in Alberta. PLoS ONE 9(12): e115535. doi:10.1371/journal.pone.0115535
Colescott, J. H., & Gillingham, M. P. (1998). Reaction of moose (Alces alces) to snowmobile traffic in the Greys River Valley, Wyoming. Alces, 34(2), 329-338.
Creel, S., Fox, J. E., Hardy, A., Sands, J., Garrott, B., & Peterson, R. O. (2002). Snowmobile activity and glucocorticoid stress responses in wolves and elk. Conservation Biology, 16(3), 809-814.
Forman, T.T. and Alexander, L.E. 1998. Roads and their major ecological effects. Annual Review of Ecology and Systematics 29:207-231.
Frair, J. L., Merrill, E. H., Beyer, H. L., & Morales, J. M. (2008). Thresholds in landscape connectivity and mortality risks in response to growing road networks. Journal of Applied Ecology, 45(5), 1504-1513.
Marion, D. A., Phillips, J. D., Yocum, C., & Mehlhope, S. H. (2014). Stream channel responses and soil loss at off-highway vehicle stream crossings in the Ouachita National Forest. Geomorphology, 216, 40-52.
Meadows, Dexter, Randy B. Foltz, and Nancy Geehan. Effects of all-terrain vehicles on forested lands and grasslands. US Department of Agriculture, Forest Service, National Technology & Development Program, Recreation Management, 2008.
Tigner, D. J. (2012). Measuring wildlife response to seismic lines to inform land use planning decisions in northwest Canada.
Valdal, E.J. and M.S. Quinn. 2010. Spatial analysis of forestry related disturbance on westslope cutthroat trout (Oncorhynchus clarkia lewisi): Implications for policy and management. Applied Spatial Analysis DOI 10: 1007/S 12061-009-9045-5. https://www.researchgate.net/profile/Michael_Quinn9/publications
Wasserman, T. N., Cushman, S. A., Shirk, A. S., Landguth, E. L., & Littell, J. S. (2012). Simulating the effects of climate change on population connectivity of American marten (Martes americana) in the northern Rocky Mountains, USA. Landscape Ecology, 27(2), 211-225
Wilkinson, L., Stenhouse, G., Barclay, R., Blackwood, R., Bonar, R., Boyd, A., ... & Penner, D. (2008). Alberta Grizzly Bear Recovery Plan 2008-2013. Alberta Sustainable Resource Development, Fish and Wildlife Division, Alberta Species at Risk Recovery Plan, (15).
Wisdom, M. J., Ager, A. A., Preisler, H. K., Cimon, N. J., & Johnson, B. K. (2004). Effects of off-road recreation on mule deer and elk.